Saturday, March 21, 2020

Tools of the Trade: Data Visualization for Logistics Mapping


A picture is worth a thousand words.

I'm not sure who said it, but it sure holds true in our world of logistics, where we are inundated with data and information, but we are short on turning this plethora of data into actionable knowledge.

Scaling these mountains of data and converting them into nuggets of actionable data has become a competitive differentiator in all industries.

Data visualization tools and techniques offer us new approaches to dramatically improve our ability to grasp information hiding in our data. It allows us to see connections between multi-dimensional data sets and provides us with new ways to interpret data.

Unlike one-dimensional tables and charts, data visualization tools enable users to interact with data, see hidden inter-relationships and allow us to take faster action to improve.

As John Sviokla wrote in his article in the Harvard Business Review (HBR),
"...I’ve seen three primary benefits of superior graphic representation:

  1. Great visualizations are efficient — they let people look at vast quantities of data quickly.
  2. Visualizations can help an analyst or a group achieve more insight into the nature of a problem and discover new understanding. 
  3. A great visualization can help create a shared view of a situation and align folks on needed actions."2

There are many companies in our logistics field that offer great visualization tools (such as Tableau, Llamasoft, Quintiq, etc.). These are relatively expensive options and typically affordable by mid-sized and larger corporations.

What about a data visualization application for the little guys or for the managers that want to make a quick visual analysis without going to an outside company?

We found a great website that can help you turn data into an impressive map visualization.

It's called GPS Visualizer (http://www.gpsvisualizer.com/map_input?form=data) and it produces maps like the one below:


If my company is sourcing components from the locations shown above and we are trying to establish our ocean consolidation strategy to move these components from Europe to Asia, for instance, then the above visual makes it very evident that we should be thinking about using a port on the Adriatic (Koper, Slovenia?) or on the Black Sea (Constanta, Romania?).

Of course, there are lots of variables that would be considered in the final decision (vessel sailing frequencies, inland freight costs to the port of load, port-to-port costs, etc.), but the visual gives you a good starting point.

You can use this tool for many studies and even incorporate the graphics into your business case or executive presentations.

Remember: a picture is worth a thousand words.

Let's take a look at the interface and how you can turn words and numbers into actionable pictures that will provide you with a better insight to your logistics network.

Step 1: you'll need to prepare your data. The GPS Visualizer requires just a few key fields (name, desc, latitude, longitude and "n").

"n" represents any number you want it to represent. Could be number of kgs./lbs. moved from each point per week or number of shipments per year, etc.

The "n" will be the shown proportionally on your map, so think through what you want to "see" with your map.

If you need to find the latitude and longitude for your locations, you can use this site (http://stevemorse.org/jcal/latlon.php). It allows you to perform batch searches as well.

Here is the .csv file we used for the map above:


Here is the main page of GPS Visualizer and the functions we used:


This site will turn your data into KNOWLEDGE and it will bring your ideas and strategies to life!

Now you can "visualize" like the big boys!

Good luck!

Sources:

1: The Top 5 Business Benefits of Using Data Visualization by Brian Gentile on September 29, 2014 (as from http://data-informed.com/top-5-business-benefits-using-data-visualization/) 


2: Swimming in Data? Three Benefits of Visualization, by John Sviokla, December 04, 2009 (as from https://hbr.org/2009/12/swimming-in-data-three-benefit).

Saturday, January 6, 2018

Tools of the Trade: Center of Gravity Analysis

Most of the larger corporations have a person, persons or department dedicated to network optimization. These folks have the sophisticated tools to determine the best modes and nodes for their material flows based on origin points, destinations, shipment sizes, shipment frequencies, transportation costs, etc.


It is impressive the number of scenarios that these people and applications can compare and optimize while considering all of the "real world" variables that we live with.


If you are not as lucky to have these resources (educated staff and expensive software), then you may be looking for some more rudimentary (i.e. "cheaper") tools!


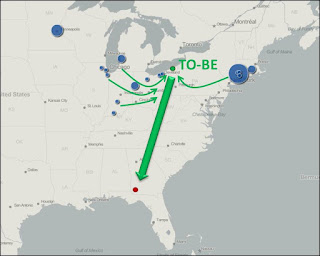
We found a (rudimentary) solution using an Excel template.


While this concept can be used for facility location decisions (such as warehouses), We used it to be sure that the consolidation center, as chosen by our 3PL, was really the optimal location based on the inbound shipments to that consolidation center.


We were shipping from many suppliers located in the northern Midwest and Northeast to our plant in the southern USA.


Our 3PL had chosen Cincinnati as the optimal consolidation point for these suppliers. Did they choose this location because their existing hub was near Cincinnati?


We wanted to find out!


Using the template below, we entered the geocodes for our suppliers' cities and assigned a weight to their weekly shipments. This method has limitations, but the assumption is that the cost/mile and per lbs. is constant from all origin points. Once you obtain the results, you can give it a sense-check.


Our analysis showed that the true center of gravity for these suppliers and the current shipment sizes is not Cincinnati, but rather some point northeast of Cleveland, maybe near Erie, Pennsylvania.


Our next step is to go out to the market to see whether an alternate consolidation point really makes sense...from a market and rate perspective.


This tool will not provide the with the “sure-fire” answer...but it can provide you with a different approach or an idea for a different direction.


Let me know if you find any value in this or were able to use it or have an alternate tool!


Good luck!

Sunday, December 17, 2017

Know Your Rates!

Many of the logistics contracts that we sign today are very complex, contain multiple services and a multitude of lanes. We know that we have achieved a certain percent of cost-down over the last contract, but, many times, the details of the deal escape us and our team.

As we move to the implementation mode, those contract details may be the key to further savings opportunities that you didn’t know existed.

It reminds me of the children’s book series: Where’s Waldo.

The deal you just signed (or inherited, if you are new to the job) contains a myriad of base rates, surcharges, transaction fees, stepped pricing matrices based on cargo weight.

To find an opportunity for savings is like finding Waldo in the beach scene below!


One opportunity that we discovered was the difference in transporting containers from Europe into the port of Houston. At first, we thought it was an incorrect rate that we had received, but after checking with our sales representative at the logistics company, we realized the difference was deliberate and due to the need to reposition 40-foot containers back into Houston.

Here’s what we found after reviewing the rates internally:
The cost to move a 20-foot container from northern Europe to Houston was $2,475.
The cost to move a 20-foot container from northern Europe to Houston was $2,450.

That’s right, it cost $25 less to move twice as much stuff (another 20-foot container!) from northern Europe to Houston!

That opened up some opportunities for real cost savings.

We reviewed our orders into Texas and the surrounding states, which discharged at other ports and developed a strategy to take advantage of the half price transport from Europe to the U.S. Gulf states.

We only found this opportunity by having a detailed understanding of what we were being billed for and why. Be sure that you and your team understand your rate structure as good as (or better than) your logistics service provider.

While investigating this phenomenon, we found that about 20% of total container flows at sea are empty and the costs of repositioning are about $400 per container for the ocean carrier.

Apparently, the positioning of empty containers is one of the most complex problems concerning global freight distribution.

You can also find reduced rates by using “non-operating reefers” (a.k.a. “NORs”). These are empty refrigerated containers that need to be repositioned back to where they are needed.

For instance, Brazil exports thousands of reefers filled with fresh produce and meat. With their rapidly growing economy, they also import a lot of dry commodities for infrastructure and development, leaving Brazil with too many dry containers and too few reefers. Due to this imbalance, many of the ocean carriers offer reduced rates to use these “non-operating reefers” to get dry cargo into Brazil.

The bottom line for your bottom line is to know the costs that you are being charged and know how to swing them to your advantage.

Find Waldo!


Sources for this article include:
1). http://compactcontainers.com/docs/Container_imbalance_strategies_JTG.pdf
2). https://people.hofstra.edu/geotrans/eng/ch5en/appl5en/ch5a3en.html
From The Repositioning of Empty Containers by Dr. Jean-Paul Rodrigue
3). http://gcaptain.com/filling-shippings-billion-hole/#.VrfjP_kw1mw
Filling Shipping’s $1 Billion Hole – The Logistical Challenge of Empty Shipping Containers from March 15, 2012 by gCaptain


Saturday, December 16, 2017

The Incoterms Square

Incoterms, officially known as “International Commercial Terms”, are a series of pre-defined commercial terms published by the International Chamber of Commerce (ICC) that are widely used in international commercial transactions and procurement processes.

There are 11 three-letter trade terms related to common contractual sales practices.

Here they are: EXW, FCA, FAS, FOB, CFR, CIF, CPT, CIP, DAT, DAP and DDP.

These terms are intended primarily to clearly communicate the tasks, costs, and risks associated with the transportation and delivery of goods as they move from seller to buyer.

For anyone in supply chain (the folks in Procurement or in Logistics), these 11 incoterms can be a jumble of letters with no real meaning. Yet these terms probably impact us the most!

An easier way to think of these 11 incoterms is to break them down into the 4 categories that these terms represent. Then it becomes easier to understand each and its impact on your sales transaction and your logistics costs.

The 4 categories are:
1. the single incoterm where the buyer is basically responsible for everything: EXW
2. the 3 incoterms where the main transportation is paid by the buyer: FCA, FAS and FOB
3. the 4 incoterms where the main transportation is paid by the seller: CFR, CIF, CPT, CIP
4. the 3 incoterms where the seller delivers the goods to the buyer’s side: DAT, DAP and DDP

Each category reflects varying degrees of cost and risk for the buyer and seller.

In the first three categories, the seller delivers by handing over the goods to a carrier somewhere on the seller’s side, that is, within the seller’s country. Depending on the terms, the place could be the seller’s premises, a carrier’s terminal, a forwarder’s warehouse, or alongside or on board a ship. Revenue can be recognized as soon as this happens.

The “C” terms are the most seller-friendly, as they give the seller the ability to select the carrier and forwarder and they allow revenue recognition as soon as the goods are handed over to that carrier or forwarder, even though it’s on the seller’s side (in the seller’s country).

The fourth category, often called “arrival incoterms,” is a destination contract term, since the seller delivers somewhere on the buyer’s side (to the buyer’s country).

Delivery on the buyer’s side means deferred revenue recognition for the seller. It also theoretically implies tracing every shipment to determine the date the goods physically arrive at the destination.

We developed this simple square to help you to better remember these 4 categories of the incoterms.

When you start at the top (EXW) and work your way clockwise around, you move from the incoterms where the most responsibility is on the buyer (the red zones) to those terms where the most responsibility is on the seller (the green zones).

Good luck!

Monday, November 20, 2017

Saturated Skies: Air Freight from Europe to the USA

Most of us use this mode only in case of extreme emergencies.


We call them expedites or premium moves and these typically move by air freight.


If you have had any expedites over these past few weeks, then we have probably shared the same experience: delays, frustration and much higher costs than usual!


The cause for the bottleneck has been attributed to an increase in cross-border e-commerce, the launch of the new iPhone (for the Asia-to-USA lane) and an increase in emergency shipments.


Our odyssey started on Monday, November 13th, which is the day we expected our 4 crates to be picked up from our Italian supplier and flown to Texas. The expected arrival to El Paso was Monday, November 20.


We had gone out for quotes and awarded the business one week prior at a cost of $3.58 per kilo. That was for the standard (STD) service level, which provided a 7 calendar day transit time. That was just the timing that our folks at the plant required; we didn't need to upgrade to the expedite (EXP) service level as that would have cost $7.59 per kilo.


Then came the e-mail from our selected logistics service provider on the day that they were supposed to pick up the 4 crates: "My EU teams (Italy, Germany, France) are continuing to check earlier departure. At the moment, our current routing option is ETA Houston on November 24th and door delivery to El Paso by Sat/Sun (Nov 25-26)."


My colleagues at the destination plant were not at all happy with this timing. They could not understand how our logistics company could have reneged on their commitment.


I pushed and demanded, but there was no way that the logistics company could secure the initial space, timing and cost.


It was at that time that they advised us about the tight capacity coming out of Europe into the USA.


All airlines, freighters and hubs were overcapacity and trying to load cargo from days before!


I pushed and demanded more!


They committed; they promised to deliver in that timing and at that cost.


That's when they directed me to the fine print in their quote: "rates are subject to change based on availability at the time of booking.”


Damn...they had me!


All the yelling and screaming and threatening was going to get me nowhere. And, besides, this was one of our best logistics providers. They knew all the ins and outs of the industry. They had come through on countless occasions. Hand-holding, repackaging, covering our sins; they always provided top-notch service, but this time, it was just not possible, because there was no solution. Even their EXP service was no longer available!


Back to the drawing board.


We started checking on our own with air cargo companies and then with the big integrators: DHL, FedEx and UPS. Two of them immediately advised that our oversized crates would not fit on their planes.


One said that they were 99% sure that they could do it and maintain our timing for a delivery by Monday, November 20th!


The cost went up to $8.01 per kilo.


My team at the plant was in shock when I provided the new cost. The program lead asked "is this a joke?"


I explained the situation and they gave approval for the higher cost. We waited for confirmation of our booking.


And waited.


The e-mail finally came on Thursday, November 16th: "We cannot move this shipment through our network."


Back to the drawing board.


We had the act quickly and be prepared to pay even more. We finally found a service that would deliver on Saturday, November 25th for $11.28 per kilo!


The week was a roller-coaster of emotions and the costs were always going up!


Although we can never predict when we will have these one-off air freight shipments, it is important to know that the end of the year is particularly vulnerable to tight capacity and ever-increasing rates.


We have some lanes that are in expedite mode through the end of the year, so you can bet that we sent out a notification to all of our plants to advise them to provide forecasts of their expedite needs for the remainder of the year and insist that our logistics companies confirm that the space has been booked in advance to avoid the issues we experienced with these 4 crates.

Wednesday, August 9, 2017

Import Customs Duties and a Snuggie

As logistics professionals, our focus is to optimize the flow of materials based on product quality, transit time and overall cost.


We optimize these areas with the support of our purchasing department, our manufacturing facilities and other functional areas.


When dealing with an international network of suppliers and customers, we need to consider the impact of customs duties on the total landed cost of our products.


Many times, this piece of the "total landed cost" equation is left out, which means that we are not properly calculating all costs.


A critical part of determining these customs duties is to understand the proper classification of our materials; this classification, also known as the Harmonized Tariff Schedule code or HTS code, is the basis for the import duty percentage one must pay to the government when importing these goods.
Surprisingly, a recent radio story highlights the importance of proper customs classification with a story about the Snuggie, a "super-soft blanket with sleeves" that is sold on-line and in your favorite retail stores!


Here is the link.


As you will hear, classifying the Snuggie to the proper HTS code was not an easy task: one side thought it best fit the description of a "garment" like a priestly cloak or a graduation gown (very high import duty rate) while others, like the importer (!), thought it was best categorized as a "blanket" which carries a much lower import duty rate.


Some $16 million was at stake in this classification controversy.


You can hear how it all plays out, but the point is that understanding the potential product classifications can cost you or save you lots of money!

Tuesday, July 8, 2014

Incoterms


Incoterms…the start and stop point of logistics! 


Incoterms rules or International Commercial Terms are a series of pre-defined commercial terms published by the International Chamber of Commerce (ICC) that are widely used in International commercial transactions or procurement processes. A series of three-letter trade terms related to common contractual sales practices, the Incoterms rules are intended primarily to clearly communicate the tasks, costs, and risks associated with the transportation and delivery of goods.


EXW (EX-Works)
One of the simplest and most basic shipment arrangements places the minimum responsibility on the seller with greater responsibility on the buyer. In an EX-Works transaction, goods are basically made available for pickup at the shipper/seller’s factory or warehouse and “delivery” is accomplished when the merchandise is released to the consignee’s freight forwarder. The buyer is responsible for making arrangements with their forwarder for insurance, export clearance and handling all other paperwork.

FOB (Free On Board)
One of the most commonly used-and misused-terms, FOB means that the shipper/seller uses his freight forwarder to move the merchandise to the port or designated point of origin. Though frequently used to describe inland movement of cargo, FOB specifically refers to ocean or inland waterway transportation of goods. “Delivery” is accomplished when the shipper/seller releases the goods to the buyer’s forwarder. The buyer’s responsibility for insurance and transportation begins at the same moment.

FCA (Free Carrier)
In this type of transaction, the seller is responsible for arranging transportation, but he is acting at the risk and the expense of the buyer. Where in FOB the freight forwarder or carrier is the choice of the buyer, in FCA the seller chooses and works with the freight forwarder or the carrier. “Delivery” is accomplished at a predetermined port or destination point and the buyer is responsible for Insurance.

FAS (Free Alongside Ship)
In these transactions, the buyer bears all the transportation costs and the risk of loss of goods. FAS requires the shipper/seller to clear goods for export, which is a reversal from past practices. Companies selling on these terms will ordinarily use their freight forwarder to clear the goods for export. “Delivery” is accomplished when the goods are turned over to the Buyers Forwarder for insurance and transportation.

CFR (Cost and Freight)
This term formerly known as CNF (C&F) defines two distinct and separate responsibilities-one is dealing with the actual cost of merchandise “C” and the other “F” refers to the freight charges to a predetermined destination point. It is the shipper/seller’s responsibility to get goods from their door to the port of destination. “Delivery” is accomplished at this time. It is the buyer’s responsibility to cover insurance from the port of origin or port of shipment to buyer’s door. Given that the shipper is responsible for transportation, the shipper also chooses the forwarder.

CIF (Cost, Insurance and Freight)
This arrangement similar to CFR, but instead of the buyer insuring the goods for the maritime phase of the voyage, the shipper/seller will insure the merchandise. In this arrangement, the seller usually chooses the forwarder. “Delivery” as above, is accomplished at the port of destination.

CPT (Carriage Paid To)
In CPT transactions the shipper/seller has the same obligations found with CIF, with the addition that the seller has to buy cargo insurance, naming the buyer as the insured while the goods are in transit.

CIP (Carriage and Insurance Paid To)
This term is primarily used for multimodal transport. Because it relies on the carrier’s insurance, the shipper/seller is only required to purchase minimum coverage. When this particular agreement is in force, Freight Forwarders often act in effect, as carriers. The buyer’s insurance is effective when the goods are turned over to the Forwarder.

DAT (Delivered At Terminal)
This term is used for any type of shipments. The shipper/seller pays for carriage to the terminal, except for costs related to import clearance, and assumes all risks up to the point that the goods are unloaded at the terminal.

DAP (Delivered At Place)
DAP term is used for any type of shipments. The shipper/seller pays for carriage to the named place, except for costs related to import clearance, and assumes all risks prior to the point that the goods are ready for unloading by the buyer.

DDP (Delivered Duty Paid)
DDP term tend to be used in intermodal or courier-type shipments. Whereby, the shipper/seller is responsible for dealing with all the tasks involved in moving goods from the manufacturing plant to the buyer/consignee’s door. It is the shipper/seller’s responsibility to insure the goods and absorb all costs and risks including the payment of duty and fees.